2020 Census undercounted BIPOC, Hispanic or Latino, renters, young children
7 min read
The Census Bureau reported March 10, 2022 that Hispanic or Latino residents, Native Americans, and African Americans were undercounted in the 2020 Census.
March 10, 2022 — The U.S. Census Bureau released results today from two analyses about the quality of the 2020 Census counts. While both showed the strength of the count for the total U.S. population, each analysis revealed that the 2020 Census overcounted or undercounted various demographic groups.
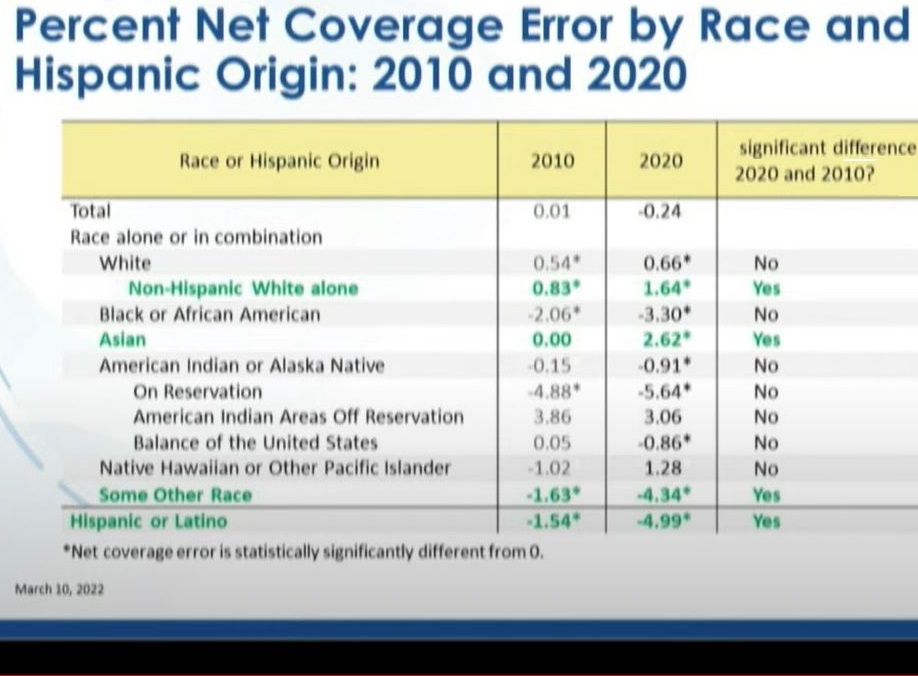
The 2020 Census undercounted the Black or African American population, the American Indian or Alaska Native population living on a reservation, the Hispanic or Latino population, and people who reported being of Some Other Race.
On the other hand, the 2020 Census overcounted the Non-Hispanic White population and the Asian population. The Native Hawaiian or Other Pacific Islander population was neither overcounted nor undercounted according to the findings.
“Today’s results show statistical evidence that the quality of the 2020 Census total population count is consistent with that of recent censuses. This is notable, given the unprecedented challenges of 2020,” said Director Robert L. Santos. “But the results also include some limitations — the 2020 Census undercounted many of the same population groups we have historically undercounted, and it overcounted others.”
The two analyses are from the Post-Enumeration Survey (PES) and Demographic Analysis Estimates (DA) and estimate how well the 2020 Census counted everyone in the nation and in certain demographic groups. They estimate the size of the U.S. population and then compare those estimates to the census counts.
The PES estimates the population using a sample survey, while DA estimates the population using vital records and other data. Both the PES and DA estimate whether certain groups were undercounted, meaning the census likely missed some people, or whether they were overcounted, indicating some people may have been counted more than once while others may have been incorrectly included.
While the two approaches are different, the results show the PES and DA mostly align, providing a more inclusive picture of who was counted in the 2020 Census.
Among age groups, the 2020 Census undercounted children 0 to 17 years old, particularly young children 0 to 4 years old. Young children are persistently undercounted in the decennial census.
National Coverage Results
The PES found that the 2020 Census had neither an undercount nor an overcount for the nation. It estimated a net coverage error of -0.24% (or 782,000 people) with a standard error of 0.25% for the nation, which was not statistically different from zero. By comparison, in the 2010 Census, the PES did not estimate a statistically significant undercount or overcount.
DA provides a range of net coverage errors — low, middle and high. This range is produced by varying the level of historical births, international migration, and Medicare enrollment records across the three series.
Depending on the series, DA results show both an undercount and overcount nationally. The DA’s net coverage error estimate was 0.22% (a slight overcount) for the low series, which includes less international migration, fewer people in the oldest ages, and fewer historical births than the other series. The net coverage error estimate for the middle series is -0.35% (a slight undercount). The high series, which has the highest international migration, more population in the oldest ages, and more historical births, shows a net coverage error of -1.21%. In contrast, the 2010 DA showed a 1.00% undercount in the low series, a 0.13% overcount in the middle series, and a 1.27% undercount in the high series.
“Taking today’s findings as a whole, we believe the 2020 Census data are fit for many uses in decision-making as well as for painting a vivid portrait of our nation’s people,” Santos said. “We’ll be exploring the under- and overcounts further. That is part of our due diligence, our pursuit of excellence, and our service to the country.”
Coverage estimates from the PES varied by race and Hispanic origin. DA coverage estimates for these characteristics are not yet available. As further explained in the Using Demographic Benchmarks to Help Evaluate 2020 Census Results blog, DA will first need to reconcile differences in how vital records categorize race with census results not yet released.
The PES data show that:
- The Black or African American alone or in combination population had a statistically significant undercount of 3.30%. This is not statistically different from the 2.06% undercount in 2010.
- The Hispanic or Latino population had a statistically significant undercount rate of 4.99%. This is statistically different from a 1.54% undercount in 2010.
- American Indian or Alaska Native alone or in combination populations living on reservations show a statistically significant undercount rate of 5.64%. This was not statistically different from a 4.88% undercount in 2010. The American Indian or Alaska Native population alone or in combination living in American Indian areas, but not living on reservations, was not statistically different from zero in 2020 or 2010.
- The non-Hispanic White alone population had a statistically significant overcount rate of 1.64%. This is statistically different from an overcount of 0.83% in 2010.
- The Asian alone or in combination population had an overcount rate of 2.62%. This is statistically different from 0.00% in 2010.
- The Native Hawaiian or Other Pacific Islander alone or in combination population had an estimated overcount rate of 1.28%.This rate is not different from an estimated 1.02% overcount rate in 2010. Both are not statistically different from zero.
Overall, the PES and DA results show similar patterns of coverage by age and sex for the 2020 Census.
For children ages 0-17, there is a statistically significant undercount of 0.84% in the PES results and an undercount of 2.1% in the middle DA series.
Similar results exist for ages 0-4, where the PES shows a statistically significant undercount of 2.79% and the DA results also show an undercount of 5.4% for the middle series.
By comparison, the 2010 DA middle series coverage error estimate for young children ages 0 to 4 was an undercount of 4.6%, while the PES showed a statistically significant undercount of 0.72%.
DA results by single year of age indicate significant “age heaping” in the 2020 Census results.
Age heaping refers to distortions in the age distribution of a population where the number of ages reported that end in 0 and 5 (e.g. 20, 25, 30, 35…) is higher than would be expected.
The primary difference between the PES and DA results is for males and females ages 18-29.
The PES shows a statistically significant undercount of 2.25% for males ages 18-29 and a statistically significant undercount of 0.98% for females ages 18-29.
DA estimates show an overcount for males and females ages 18-29, except for the high series for males. For these ages, the difference between the high series assumes more international migration than the other series.
DA estimates are produced for the total population living in the United States on April 1, 2020, while the PES estimates are produced for the household population living in the United States excluding Remote Alaska areas. A lot of people in this age group live in college dorms, which are not part of the PES sample, and this may account for some of the difference in coverage patterns between the PES and DA results.
Researchers at the Census Bureau acknowledge this notable difference and are researching the PES and DA disagreement.
In comparison, the 2010 DA net coverage error estimate for ages 18-24 population was 1.6%.
The PES and DA estimates of net coverage error for adults ages 30-49 show very similar patterns. Males in this age range showed a statistically significant undercount in the PES. DA also showed an undercount.
The PES found a statistically significant overcount of 0.55% for age 50-and-over males and a statistically significant overcount of 2.63% for age 50-and-over females.
DA shows similar results for males and females ages 50 and older, where, except for the high series for males, the net coverage error estimates show an overcount.
Homeowners were overcounted while renters were undercounted in the 2020 Census, according to the PES. DA does not analyze coverage estimates by tenure.
- Homeowners had a statistically significant overcount of 0.43%.
- Renters experienced a statistically significant undercount of 1.48%.
Included in the PES are the estimates of the components of coverage — the number of correct census records, erroneous enumerations, whole-person imputations, and omissions. Coverage estimates by component are not included in the DA results.
The Census Bureau estimates that among the 323.2 million people who were living in housing units on April 1, 2020:
- 94.4% were counted correctly.
- 2.2% were counted erroneously (1.6% were duplicates and 0.6% were erroneous for other reasons).
- 2.8% provided only a census count and had their demographic characteristics imputed, or statistically inserted.
- 0.6% needed more extensive imputation after all census follow-up efforts were attempted.
In the PES, the Census Bureau estimated 18.8 million omissions in the population. Omissions are people who were not correctly counted in the census. Some of these people were missed by the census. However, omissions may have been accounted for in the census counts as whole-person imputations.
Together, the PES and DA results are an important piece of evaluating the quality of the 2020 Census and planning for the 2030 Census. The Census Bureau has also released operational metrics, worked with outside experts, and is currently working on a series of extensive evaluations of 2020 Census operations. More information about each of these efforts is available on the 2020 Census Data Quality website.
“We remain proud of the job we accomplished in the face of immense challenges,” Santos said. “And we are ready to work with the stakeholders and the public to fully leverage this enormously valuable resource.”
About the PES and DA
The PES creates an estimate of the number of people living in the United States on April 1, 2020 (excluding people in group quarters, such as nursing homes or college dorms, and people in Remote Alaska), by surveying a sample of people in the United States and matching their records to the 2020 Census. This independent evaluation of the 2020 Census provides an estimate of the proportion of people counted in the census by age, sex, race, Hispanic origin and housing tenure.
DA uses current and historical vital records, such as birth and death records, to produce a national-level estimate of the U.S. population on April 1, 2020, by age, sex, broad race categories, and Hispanic origin. DA estimates are completely independent of the 2020 Census.


