
How does Eugene compare to Salem, Bend, Spokane, Boise, and Fort Collins?
16 min read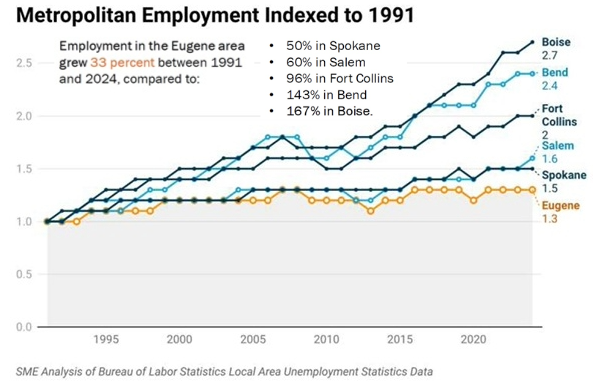
Presenter: How does the city of Eugene compare to similar cities in the region? The City Council heard on March 11 from consultant Sarah Emmons:
Sarah Emmons: The city was benchmarked against a handful of cities that are similar and different—as we’ll talk about. These are Salem and Bend in Oregon; Boise, Idaho; Fort Collins, Colorado, which is home to Colorado State University; and Spokane, Washington. All of these cities were selected because they are either located in Oregon or they’re in the Northwest or the Mountain West.
And a few of them have either a large university just like Eugene does, or at least a major employer that really drives a portion of the economy. For Salem, that’s obviously the state government and for Bend, that’s obviously the recreation economy.
Whenever I give a benchmarking presentation, it’s really almost impossible to do a perfect comparison across cities. So we’ll take a look at some census data, and these are the takeaways from my analysis from mostly American Community Survey data from 2024. And these are that:
- Eugene has fewer children and fewer people of working age than the other comparable cities;
- Eugene’s younger households have lower incomes and of the homeowners in Eugene, they’re less likely to be these younger households, even compared to Fort Collins, which is another kind of large population college town;
- And then third, that Eugene has more homeless people, which again, you know, is a statewide issue, and more cost-burdened renters than other cities in the group.
Eugene has a lower share of its population under age 18, so it’s proportionately fewer children than the other cities on this list, especially when you look at Salem, which almost 22% of the population is under the age of 18.
Jumping over to this age 25-to-44 category, this is the other category that kind of pops out to me: Eugene has fewer of what I would call a working-age population, so people in the age of 25 to 44, 26% compared to 32% in Spokane, Washington.
These populations, you could think maybe go together ’cause these, this is the population that might have children in the under-age-18 category.
So I just thought that was interesting once we kind of split out this population by age and looked at it, more closely.
When we think about those populations, it’s interesting to think about income, and my takeaway is that Eugene’s younger households—so not the student-age population, which of course you would expect does have significantly lower incomes than other cities in the group, but really this younger household population, so households that are headed by people aged 25 to 44—have lower incomes than the other cities on the list.
They do as well for that 45-to-64 age range as well. So they’re second-lowest, above Spokane only, for incomes in this group. (But it would exclude any capital gains related income.)
So the takeaway again is that younger households have lower median incomes than they do in the other cities in the group.
Also, just before we move on, thought it was interesting that the very young population has significantly higher incomes in Bend than these other college towns. I’m imagining that’s because younger folks there working in the recreation industry, tend to be just working more than the students.
Presenter: In examining the housing data, she said Eugene has the highest percentage of renters. Sarah Emmons.
Sarah Emmons: Eugene does have more renters, so they’re 52% of people in Eugene are renting and 48% are living in owner-occupied homes. And Fort Collins is the second-most renters. And this makes sense just given the relative share of the student populations was so high in Eugene and Fort Collins compared to those other cities.
Another interesting aspect relates to the fact that Eugene is relatively low square mileage compared to these other cities. So I did like a very rough measure of density, which is just population per square mile, which is not a planner’s definition, so forgive me, but I thought it was interesting to point out that, you know, in addition to having a lot of renters, Eugene has a higher population per square mile, so greater population density than these other cities.
And I thought this was really interesting, when we think about the fact that fewer people in Eugene own homes, that so many of them are over age 65 relative to these other cities, and that was the case for the other Oregon cities as well actually by a significant margin.
When you look at the greatest share of people in Boise, for example, who own homes, they’re in that kind of older working age population that we talked about, the 45-to-64. So I wanted to point that out.
Homelessness, is of course obviously a statewide issue. I believe Oregon ranks only behind Hawaii and New York in terms of homeless counts. And Eugene has one of the highest counts in the state, so Eugene has higher rates of homelessness.
Cost burden among renters: So housing costs over 30% of income in the last 12 months; for Eugene and Fort Collins these are at the higher end of this rating. It’s an important stat to point out, as decision-makers are thinking about what the city looks like and just, you know, making decisions about housing and housing costs as a share of income, we’re at the bottom end of the range here.
We also talked a little bit about crime rates and so Eugene has the second- highest property crime rate of the cities in this sample, behind only the city of Spokane, but its violent crime rate is exactly in the middle of the pack here compared to the other cities.
Hopefully that’ll give you kind of an overview of how the city feels as a community.
Presenter: Sarah then turned to the budget findings. She said Eugene provides more services, and has more employees than the other cities.
Sarah Emmons: Eugene spends less per capita than all of the cities in this group in FY 2025.
Another takeaway is what the responsibilities are of Eugene as a city compared to the other cities on this list, and the takeaway for me is that Eugene is comparatively full-service, compared to these other cities, which directly relates to the headcount. The city does have more FTE (full-time employees) in-house than other cities that we looked at.
The Oregon cities are more reliant on property taxes than other cities, and the property tax system is more constrained than other states in this group.
So when we talk about city budgets, it’s really important to understand what the city itself as a government entity is responsible for, in-house, compared to other jurisdictions or districts or entities that might operate in these regions.
So the first takeaway for me, when I put this data together is, I mean, every city has Central Services, which is your management and administrative functions, and every city is required, of course, to have police service.
But when you go from municipal court all the way down to streets, which are also something that every city has to take care of, Eugene is the only city on this list that has an ‘X’ in every line here. So, for example, Eugene and Fort Collins are the only cities that operate 911 dispatch; (Eugene is) one of the only cities that operates both parks and libraries.
So with that kind of context in mind, we’ll focus on city spending. Again, from FY25 adopted budgets for each of the cities: Eugene is the second-lowest in terms of total spending and the third-lowest in terms of general fund spending, although you can see it’s kind of on a par with Fort Collins and Salem, which actually are very close to it in size.
As you know, total spending can only tell you so much when these cities have different responsibilities and are different in size. So we took a look at the city spending data in two different ways, attempting to normalize it both across population, as well as as a share of household income.
So by both of these different measures of comparison, Eugene is at the lower end in terms of total spending, but about the same in general fund spending as the other cities.
The fact that its general fund spending is on a par with the other cities is interesting to me because many of the functions that I called out in the service chart are what you would consider general services that are typically funded, at least in part, from the general fund. So Eugene is really stretching these dollars far when you think about how many responsibilities it has in-house.
Okay. So, as you know, for most local governments and Eugene is no exception, the personnel costs are really one of the true drivers of spending levels, so we can’t talk about city budgets without looking at headcount.
Eugene does have the third-highest per capita headcount of all the cities in the group, and the highest headcount of the Oregon cities on a per capita basis.
And again, this, directly relates in my mind to the number of functions that Eugene is responsible for in-house, not a normative statement at all, just kind of trying to explain where the data are coming from.
Eugene has the second-highest spending in terms of police, the third-highest fire spending, and the second-lowest spending on parks of all the cities in the sample.
And one of the reasons that Fort Collins and Eugene are at the higher end of this group is that they both include 911 dispatch functions, which are not staffed in-house in the other cities.
Eugene is about, ooh, second-or third-lowest in fire staffing in the cities on this sample. And again, Eugene, Bend, and Salem do operate ambulance services in-house, so something to know, just in terms of the city responsibilities. Spokane also pays for ambulance services but does not operate it. So it would appear in their budget, but not in their headcount.
Presenter: With her review of city spending complete, she turned to revenue. Sarah Emmons:
Sarah Emmons: That wraps up sort of the spending portion of the analysis so now we’re gonna move to the revenue side of the ledger and how those services that we just talked about are paid for. And of course, property taxes are the largest source of general fund revenue in the city of Eugene and the other Oregon cities as well.
All states have some sort of constitutional and or statutory limitations on local property taxes. But I will point out that only Oregon has both a limitation in how much property tax levies can grow per year as well as a limitation on the overall size of the rate.
Washington does have both a growth limitation and a rate limitation. But I think one of the differences between Oregon and Washington and why Oregon’s system is more restrictive is that Oregon also has a permanent rate, which the state of Washington does not.
Oregon also has the freezing of assessed value at kind of 1997 levels. And I think that’s also critical to understanding why property taxes are so constrained in Oregon.
So outside of property taxes, what taxes do these cities have access to or authority to implement to pay for general city operations? We looked at a few different categories of taxes.
City sales tax is actually legal in Oregon, but very, very, very uncommon. I think there’s one city that has a food and beverage tax, but other than that, this is not found in Oregon.
Idaho cities are also not—I don’t know if they’re not allowed or they just don’t do it—but there’s no local sales tax in Boise, but the city does receive a portion of state sales tax revenue, and as one of the larger cities in Boise, that portion is significant.
Fort Collins has a relatively high sales tax rate at 4.35% on sales other than food. And then Spokane has a 1.1% and there’s a bunch of different kinds of local options here in Washington state where I’m based, that cities have access to.
Eugene is the only city on the list that has a local gas tax. And then there are different other kinds of excise taxes. And by excise taxes, I mean taxes that are designed to excise a portion of economic activity that is happening within city boundaries. So everybody but Boise has some sort of excise tax.
And then in terms of other taxes, Eugene of course has the community safety payroll tax, and so the takeaway from this is that in terms of other tax options, Oregon cities really don’t have as many commonly-used options as these other cities and other states do.
Presenter: Sarah noted that two Oregon cities impose fees.
Sarah Emmons: Salem’s operations fee is, I believe, deposited into its general fund because it does fund general operations and then a transportation fee that’s imposed in Bend and is designed to take care of capital and maintenance and operation needs in Bend.
Both of these are fees that are collected through utility bills. They’re becoming increasingly common in Oregon. But they are designed to support broader city operations.
States that allow sales tax, they are significantly less reliant on property taxes than they are on other taxes like sales taxes or excise taxes. Again, not a good-or-bad statement, just kind of pointing out one of the differences.
Almost 94% of Salem’s taxes are property taxes, whereas in Eugene it’s about 77%.
So when we talk about tax burden and kind of comparative tax bills, it’s important, at least in the Oregon context to really understand property tax rates and the differences in the cities that we looked at for this analysis.
Eugene has a higher city property tax rate than the other two Oregon cities in this group. Eugene’s total city property tax rate is $8.20. In Bend, it’s about $4.14 cents, which sounds low, but of course as anybody who has paid a property tax bill knows that’s, you know, that’s not your whole property tax. You’re also paying taxes to other districts that are levying property taxes in the city as well.
So though it has comparatively higher property tax rates, the average tax bill in Eugene is significantly lower than Bend and relatively close to Salem.
Presenter: She closed her presentation by looking at job growth.
Sarah Emmons: It really was remarkable to look at job growth in Eugene compared to the other cities in this group and how much Eugene’s growth has lagged compared to those cities.
How much has employment grown in the time period of 1991 to 2024? And in Eugene, it has grown significantly less than in the other cities. In fact, it’s the only city where population growth (despite not being remarkable in Eugene) has exceeded job growth.
The Eugene region has seen 33% growth during this time period compared to 50% in Spokane, 60% in Salem, 96% (so almost doubling) in Fort Collins, 143% in Bend, all the way up to Boise, which has seen just incredible growth (167%) over this time period.
And so Eugene is clearly kind of lagging, at least in this group.
Eugene’s really the only city where the city population has grown more than regional employment. Even though population has not grown astronomically— in fact, it’s the second lowest growth of all the cities on this list except for Spokane—still it’s grown faster than at least one measure of economic health or economic growth, which is the number of jobs.
So we can read this as the demand for services has grown faster than the economy, even though population growth has not been off the charts here, and again, this is that same time period, 1991 to 2024.
Presenter: Councilor Mike Clark:
Councilor Mike Clark: Sarah, thank you. I have longed for us to do this sort of comparative financial review and analysis for years. I have wanted to look at the statistics of how we stack up compared to other cities and other communities in the general West, in a similar way for a very long time. And I’m really glad we’re doing it.
I’m going to stay the optimist here and say that I think that from this sort of data, we can learn a great deal. If we find an area we’d like to grow and we’d like to do better, I suspect there are ways we can take advantage of the knowledge based on what other people do that can assist us. We don’t have to take the bad parts.
So I thank you for the work. It’s phenomenal. I really appreciate it.
And the reason I want to know more about what kind of information is available, 10 years ago I made a lot of arguments that I thought our land use policies would make us more dense, certainly, but it would create a reality where young families would move to the surrounding communities and that may not serve us. That was my argument at the time.
And so I think in this data we see it reflected that a lot of younger families with young children don’t live here comparatively to other communities. But I believe they live in the surrounding areas around Eugene and interact and use services in Eugene. Is there a measurement of that in between the comparative cities of some nature?
Sarah Emmons: It’s a really good question. I worked as a part of the city of Springfield, we did a very similar analysis for their work and there we did look at household size, and in that analysis the city of Springfield had significantly larger households and more children than Eugene.
I haven’t looked at neighbor cities in these other regions, but I think that Eugene may be unique in having that kind of next-door-neighbor city right there that has kind of relatively robust services as well.
I’m also doing similar work in the city of Corvallis, which has Albany right next door. And so a lot of the questions that you bring up are, I think, really relevant, especially in cities that are not like the kind of big anchor city in a region, like a lot of small suburbs.
Councilor Mike Clark: As we move forward, can we get any further information or research that you have done or may at some point do about regional statistics with regard to all the comparative cities in this particular set?
Sarah Emmons: Yeah, definitely. I can at least provide a little bit on the Springfield analysis and maybe Corvallis, Eugene, and then give it some thought as well.
Councilor Mike Clark: I would include our areas of like Veneta, Elmira, and Creswell and Junction City and Coburg, all of the surrounding smaller communities make up a different nature I think than in many cities, and that’s what I’d be interested in having.
Presenter: Councilor Randy Groves:
Councilor Randy Groves: The airport piece, I think was a significant thing that maybe could be better explained in there. Eugene runs an FAR Part 135 Index C airport that’s heavily used. Bend has a general aviation (GA) airport, their commercial airport’s in Redmond. Salem has a few commercial flights, but most of it’s, again, a GA airport. Spokane’s an international airport, and so is Boise.
That would just help with some of those adjustments, but we do run a full suite of services.
And then I also, I agree with Councilor Clark. I was going to raise the issue of wanting to know more about the effect of our surrounding communities because they’re all growing, not just in housing, but they are growing in jobs as well.
And I would be interested to know if they’re growing at a faster rate than we are, at the same rate, or a slower rate. That would be something we want to look at as well.
And part of that is because some of them have available land, when we have a constrained land inventory. And I think all these pieces go together as we try to put together how we’re going to build our economy, how we’re going to handle housing. We’re already more dense than these other communities.
Presenter: Councilor Matt Keating:
Councilor Matt Keating: Bend is clearly booming both in population growth and in regional employment. Sarah, what’s your, like, high-level takeaway as to what Bend is doing right? Why is Bend attracting people and attracting the businesses within that region?
Sarah Emmons: Well, my takeaway is that Bend is as beautiful as any city, including Eugene and the surrounding area, but didn’t already have a University of Oregon there, you know, so the recreation economy could become the anchor. I am not an economist I should say, but that’s kind of my observation.
In Boise, there is a huge growth in tech that I think we talked about, and then some downtown revitalization efforts, both in Boise and Spokane.
So this brings us to this benchmark from in this case WalletHub. And this is called ‘The best and worst-run cities in America,’ although I’m really not sure if it’s really the worst run because I didn’t see anything actually bad that mentioned in these other cities.
I’m also not really sure how they grabbed the 148. Like there’s some very, very tiny cities. For example, I think the No. 1 city, ranked city in this list was, Nampa, Idaho, which is the population is obviously very tiny. And then Fort Collins and Bend are not on the list, which I don’t know if that’s good or bad.
But anyway, Boise was No. 4 on this list. Eugene was No. 32, so in kind of the top fifth. Salem was No. 49, so in the top third of this ranking. And then Spokane was No. 87, so right in the middle.
And what this ranking attempted to do was to take a number of factors like financial stability, economy, safety, and infrastructure, and then some other aspects like education, health, and pollution, and roll them up into, sort of, how well-run are these cities.
Presenter: Mayor Kaarin Knudson:
Kaarin Knudson (Eugene, mayor): Thank you, Sarah. I really appreciate this presentation today and this update.
I just want to say at the outset that Sarah, some of what you shared about the ways in which the city of Eugene is stretching resources that we do have, I would think that that would lead to being one of the best-managed cities in the country—to be very creative and collaborative, and to be resourceful in how we’re meeting some challenging community needs, especially in light of the rest of the information that you shared in this presentation—which I think paints a picture for us that will help this Council and our new city manager and future councils to do really important work, building greater opportunity and greater stability in our community.
I think this work illuminates some blind spots that we have had, and also provides us with the opportunity to interrupt some long-held narratives that perhaps are not serving us as well as they could. And all of that I take to be really positive.
Presenter: A consultant compares cities and reports that Eugene has fewer children, fewer people of working age, more renters, more homeless persons, and is not creating as many jobs, yet offers more in-house services.