
Sheltered homeless count jumps 52% as housing remains scarce
5 min read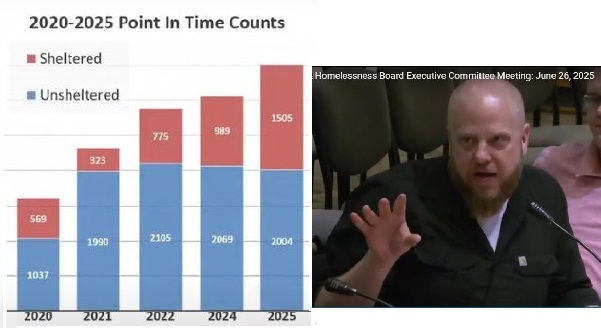
Presenter: This year’s Point In Time (PIT) count showed a big jump in the total number of homeless persons: The count of sheltered homeless is 52% higher than last year. The Lane County Poverty and Homelessness Board’s Executive Committee heard June 26 the housing vacancy rate in Eugene Springfield continues to lag behind other metro areas nationally and in Oregon. James Ewell:
James Ewell: Hi, I’m James Ewell. I’m the homelessness and community action manager with Lane County.
[00:00:29] So the results of the Point In Time count were released last month. I’m going to touch a little bit on some of the trends that we saw this year, and then also some reasons that we think that may have led to the increases in homelessness that we saw.
[00:00:42] So as a brief reminder for folks, HUD and OHCS require that Continuums of Care conduct an annual count of folks experiencing homelessness on a single night in each January. This year’s PIT count occurred in Lane County on the night of Jan. 29.
[00:00:58] Because of the YHDP (Youth Homelessness Demonstration Program) funding that we have, we did also have a special focus on counting youth experiencing homelessness this year. In addition to the standard ways we’ve been surveying folks through the PIT, there was also a youth event held at the Youth Era drop-in center downtown. So they had food and I think a raffle and just some strategies to try to bring youth into that event.
[00:01:24] As has been the case now for several years, we supplemented our HMIS data with in-person surveying by our street outreach team. So we continue to have full geographic coverage of street outreach across Lane County, and we’re able to utilize those outreach teams to help with surveying again this year.
[00:01:44] And that’s really the piece of us using HMIS so robustly for the PIT count is unique across the country. And we again received special permission from HUD to be able to utilize our by-name list data for our PIT count. And our HMIS team was recognized and were presenters at a national HUD event this year to share the model that’s used.
[00:02:10] So just a testament to our community’s HMIS data and how robust it is and how accurate of a reflection it is of folks experiencing homelessness in our community.
[00:02:20] So as I’m sure is not a surprise to this group, we do continue to see the number of people who are unhoused in Lane County grow. One, I think, key point of this year’s count, is that Jan. 29 was a night that severe weather shelters were open.
[00:02:37] So, Egan Warming Centers, Catholic Community Services, hoteling, I believe the Cottage Grove Warming was open Jan. 29, and so we saw nearly 500 additional shelter beds that were operating that night, which likely results in a much more accurate count because, you know, there are folks that are not going to access shelters whether because they’re not available on a given night or they’re not interested.
[00:03:04] But when there’s a severe weather event and there’s beds available and obviously being outside is incredibly dangerous, we see folks that may not normally access services showing up at the warming centers.
[00:03:16] Continue to see that housing scarcity is a primary driver of increases in homelessness across the country and in our community. Additionally, as we have moved out of the pandemic, you know, at the height of the pandemic, everyone was being told to shelter in place and that included folks experiencing homelessness and encampments. So when we were doing PIT counts during the height of the pandemic, it was easier to locate unsheltered individuals because they were largely remaining in the encampments that they were in.
[00:03:48] As we’ve moved out of the pandemic, unsheltered individuals are being scattered more regularly, which makes it harder for street outreach teams to be able to find them and engage with them.
[00:03:59] A couple notable highlights of this year’s count: We saw that 52% more people were sheltered, largely due to those severe weather beds being open, and slightly fewer folks were unsheltered than the 2024 count.
[00:04:16] Additionally, the percentage of individuals who are chronically homeless and sheltered has increased from 2020 to 2024 from 25% to 46%. With point counts over the last five years, you see a steady increase in both unsheltered and sheltered homelessness and then again that noticeable increase this year in the amount of folks that were sheltered.
[00:04:41] And I know we’re talking about human beings here, so the terms inflow and outflow aren’t meant to devalue the fact that these are human beings we’re talking about that are experiencing homelessness.
[00:04:50] But in January of 2025, we had just over 1,000 new individuals entering into the system; 3,333 were currently in the system, and then in that month, we exited 748. So clearly more folks are entering into our homeless services system that are exiting out of the system.
[00:05:10] So we need to look for strategies that can be used both to decrease that inflow. So things like homelessness prevention, diversion, and then ways that we can turn the faucet and increase the outflow of folks that are exiting into permanent housing.
[00:05:27] So when you look at the best way to exit folks into permanent housing, that’s obviously working, to find housing in the community to get them into. And as I previously noted, we continue to see that available housing in our community is, or the lack of is. the primary driver of the increases in homelessness.
[00:05:47] So when you look at healthy vacancy rates, which ‘healthy vacancy rate’ is defined as basically you have demand meet supply. And so that’s been deemed that 5% to 7% vacancy rates are considered healthy for a community. When you look at the national average, it’s been within that healthy vacancy rate or slightly above at times over the last five years. When you look at the Eugene Springfield metro area, this is specific to Eugene Springfield, not all of Lane County, we have not ever hit a healthy vacancy rate in the last five years and have been quite far from doing so several of those years.
[00:06:25] And this comes from the Multifamily NW which is a property management and landlord organization, and they release this data (I believe) quarterly.
[00:06:36] And comparing the Eugene Springfield metro area with other communities in Oregon: In addition to nationally, Eugene Springfield across other Oregon communities continues to have reduced vacancy rates in comparison with other cities that are similar.
[00:06:52] It’s especially noticeable when you look at three-bedroom units. So when you think about families in our community that are experiencing housing instability that have children, incredibly difficult for those households that have multiple children, multiple members to be able to find three-bedroom units that they’re going to be able to move into.
[00:07:12] So in summation, obviously there are multiple factors that lead to increases in homelessness, but really just continue to see that the importance of our community needing to work on increasing the outflow by helping to create more housing opportunities in our community.
[00:07:33] Presenter: The Poverty and Homelessness Board’s Executive Committee hears the latest analysis on the annual Point In Time homelessness counts.