Lane Transit District resumes bus rider reports
5 min read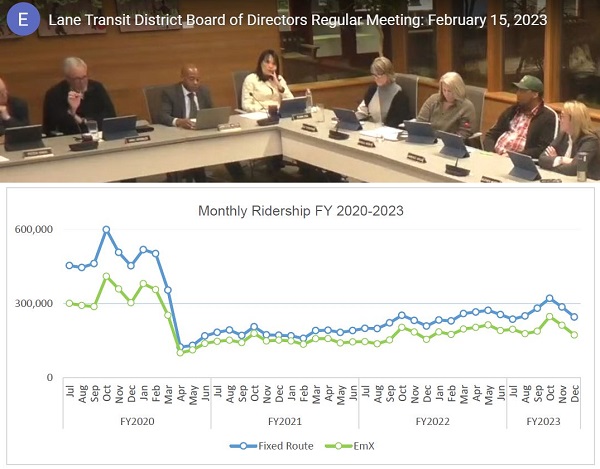
LTD unveils a new ridership report. At the February 15 board meeting:
[00:00:07] Gino Grimaldi: We may be a little light in terms of subcommittee reports, but are there any to talk about today? Pete?
[00:00:13] John Q: Speaking about two merged committees, Strategic Planning (SPC) and Comprehensive and Accessible Transportation (CATC), LTD Board Member Pete Knox.
[00:00:21] Pete Knox (LTD board): We had our first combined SPC and CATC. I think it went really well. We did get to see some new reporting system as far as ridership, which you’re going to see in your packet. And, a couple of other things that really aren’t yet rising to the board’s level yet.
[00:00:39] Gino Grimaldi: Thank Pete. …Okay, moving on. Monthly ridership and service report refresh, Tom?
[00:00:47] Tom Schwetz (LTD planning and development director): We’re excited about being able to reintroduce the monthly report that we used to provide to the board. As the memo indicates, we stopped doing that in February of 2022. For a couple of reasons. One is it had gotten extensive and a lot of details that were of interest to board members back in 1999 and weren’t that useful today.
[00:01:12] So it was very difficult also to pull the data from the old systems and do the calculations. So we wanted to kind of start fresh. And so what you have, it’s a two-pager. We took this as an example from something we saw TriMet doing.
[00:01:27] Their report has a little more data, but we wanted to take an approach where, what’s useful to the board? Let’s talk to you about what’s useful, what can we do? The intent here is that this is a starting point and we want to come back to you, try and do it over the next couple of months.
[00:01:44] Maybe we can get into a work session where we can kind of workshop this a little bit more. But we obviously have a lot more data we could share, but not all that’s useful or timely. And we want to try and get something that you’ll find not just interesting but informative and by extension, you know, this report goes out to the community as well.
[00:02:03] So something along those lines is our intended process.
[00:02:07] So we started with looking at ridership. And that’s the general title. We can get into a lot more. But at this point in our history, obviously we’re interested in where we’re at relative to, you know, pre-COVID.
[00:02:21] And I’ll say from a planning standpoint, an analyst standpoint, we’re interested in the upward trend there on our ridership. Right now we’re showing monthly. We might move it to quarterly just so you can continue to see the trend.
[00:02:33] You can see the EmX, we’re carrying about 40%-45% of the ridership that we carry in a month or week here, on EmX. And that’s about what we were doing before as well. And again, you’ll get the numbers in terms of EmX and fixed route.
[00:02:49] We looked at giving you some information on the service hours by day type. As you know, we operate three day types per week. The five weekdays, we operate the highest level of service. Saturday, it was a little less. And then Sunday is a lot less than weekday.
[00:03:05] Over time we’d like to change that, right? We’d like to get more service on the weekend. That’s kind of an equitable investment. But you’ll be able to see that in the report as we move forward. The other thing that is always of interest both to us and I think to you and the public is, you know, how productive is our service.
[00:03:21] And so you can see here, even though we carry 40% on EmX, our productivity is much higher, and that’s always been the case. It’s 10-minute service for the most part. And it’s always been very productive.
[00:03:34] EmX ridership is a little more sensitive to activity going on at the U of O. So you’ll see some bumps there that, that don’t necessarily echo in the fixed route.
[00:03:42] There’s I call it ‘The October Dip.’ Almost every year you see where things go up and then in October they go down again. That’s actually, it starts at school. Gets into the Thanksgiving, students go home, the term is over. So the ridership dips and it stays down, and you can see on a regular basis you’ve got in through Christmas and in into the new year, it’ll be lower and then again, the students come back.
[00:04:09] But anyway, that gives you a sense of the basic information we provide and we’re really interested in, ’cause we got a whole lot more data we could share to really figure out what works best for you, and again, might be of interest to the public.
[00:04:25] Gino Grimaldi (LTD board president): Questions or comments? Pete.
[00:04:29] Pete Knox (LTD board): Yeah, I’ve got to say one of those things I really like about this new format is that it’s really easy to look at trends, data, and it’s, I think as a board member, individual numbers are not as important to me. They’re probably very important to you guys in planning, but the trends, what are the overall trends, are far more interesting for us, because everything we do is at the 10,000-foot level.
[00:04:56] John Q: Those trends may reflect the post-pandemic economic recovery. From the Oct. 6, 2021 budget committee:
[00:05:05] Christina Shew (LTD finance director): If you’ll recall, when we did the fiscal year 20-21 budget, we had the students come in, they showed you different scenarios. And there was like the worst-case scenario. There were like three different recovery options for the pandemic. And we as a board suggested that we take the most conservative, so we were very conservative and we anticipated that it was going to drop significantly.
[00:05:35] Emily Secord (former LTD board member): Yes. Thank you for that refresher. As soon as you started describing it, I was remembering those graphs, like the V and the W and whatnot.
[00:05:43] John Q: A fresh start for the LTD ridership report, with more data to come.
