UO researcher Anne Brown shares data from the Eugene sidewalk audit
6 min read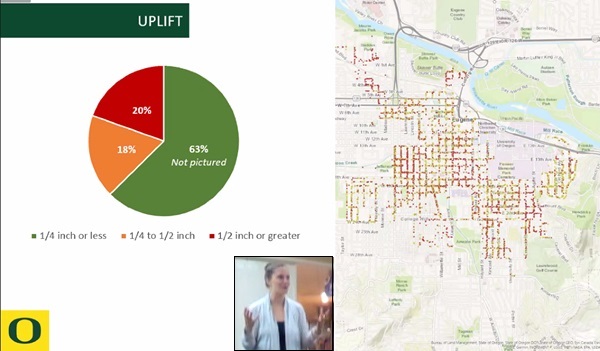
The Active Transportation Committee hears about a sidewalk audit conducted by students at the University of Oregon. On Nov. 9:
Anne Brown: I’m Anne Brown. I’m a faculty at the U of O in Community and Regional Planning and I research issues of transportation. What are the conditions of our sidewalks in Eugene? They’re not great. Probably not really shocking news that our sidewalks are not in great shape.
[00:00:22] But our question was: How not great? And really, what are the issues? What are we seeing? How can we measure this impact? And how can we build maybe a tool and a database the city could use, both to think about leveraging public support for more funding, identify opportunity areas to reinvest, and provide a public data set for public and the city staff?
[00:00:42] So we conducted a sidewalk audit. And it’s like a bank audit or a tax audit; it’s really taking a deep dive and looking square by square at what is the condition of our sidewalk.
[00:00:52] There are a lot of cities that have conducted sidewalk audits to date. So we looked through previous research, looked through how other cities have conducted sidewalk audits, what they measured, how they actually went about doing that.
[00:01:05] And we looked at ADA (Americans with Disabilities Act) guidelines as well. There’s ADA guidelines around exactly how sidewalks, how wide they need to be, how much cracking or uplift in terms of that bump there is in the sidewalk, how much there can be.
[00:01:19] We interviewed the City of Seattle’s Public Works team. They conducted one of the best sidewalk audits to date. They had a pretty large team and spent over a year doing this. So luckily, they built a lot of groundwork for us to really start with that.
[00:01:31] So students are lovely and tech-savvy and always carry their smartphones with them. And so we developed an app; GIS (Geographic Information Systems) allows them to mark exactly where they are. And then there’s a whole host of questions about each data point they’d enter.
[00:01:49] We look at height differences, so uplift, how much sidewalks have popped, basically. Largely we’re looking for: Does it comply with the ADA or not? Anything under a quarter of an inch in terms of that uplift is ADA compliant. Anything above that is not. So there are some challenges for our sidewalks.
[00:02:08] We also did passage and obstruction. So if you think about walking down a sidewalk or rolling down the sidewalk, right: Are there poles in the way? Are there fire hydrants? Are there vegetation, right? We only counted things that were permanent obstructions and poles, fire hydrants, etc. We didn’t count things like if someone was throwing out a mattress in their house.
[00:02:24] We looked at running slopes. There’s two slopes we measured. Running slope is essentially if you’re looking forward, how hilly is the sidewalk. The cross slope, the opposite, it’s perpendicular to you. Most sidewalks have a little bit of slope to them for drainage purposes, but you don’t want too much.
[00:02:41] And then we looked at service conditions. This is a little more arbitrary. We really want to try to capture that idea of cracking where there wasn’t necessarily a lot of absolute height differences, but the condition of the pavers was pretty poor. So we see there’s a range from perfect (no cracks at all), good (might have some cracks, but it’s not really impeding your ability to cross squares), and then all the way over to critical where the piece is missing, So, this is a little more arbitrary, but again, trying to capture that surface condition of the pavers.
[00:03:10] We collected data from February to June. About 15 students collecting data, anywhere from four to 14 hours a week. I allowed them to select the zones. We collected almost 14,000 data points. So we did well. There’s a reason it took us a long time to collect data. It’s the equivalent of 20 acres of sidewalk pavers. So we had how big the pavers were, how long they were, etc. So it’s a lot of data.
[00:03:35] We didn’t collect data on sidewalks that were in perfect condition, with no uplift, with no passage issues. So any point here has some issue, not 14,000 points of perfect sidewalk.
[00:03:49] Street trees are one of the biggest reasons there are sidewalk issues: uplift, cracking, etc. Street trees are wonderful, but they are not friendly to sidewalks. So there are different strategies that other cities have employed to try to have those two work a little more harmoniously together. There’s different technologies or paver surfaces, et cetera. So if the city takes this on at a larger scale, again, some resources and examples of other cities to consider, hopefully make them last longer.
[00:04:17] We also collected 1,300 data points on crossing treatments. So when we talked with the city about creating this, they said, ‘You know, we also don’t know exactly what kind of crossing treatments there are, so are there signs, striping, etc.’ So we’re be out there anyway. Let’s just collect these data too.
[00:04:37] So each observation could be between one and 20 pavers (like a single sidewalk square).
[00:04:44] Most sidewalks we observed were not obstructed. Again, they might have had other issues, but they weren’t obstructed by law. The majority of obstructions were vegetation, so they weren’t things that couldn’t be addressed. That’s the positive side here, there’s 500 observations of vegetation.
[00:04:59] Even what these data in just this one part of the city showed, I guess we probably have a need for more revenue. So here’s just some possibilities. There’s some cities that raise revenues through development fees. So those could be in-lieu developer fees. So in terms of development, developer pays fee into a pot, that pot is used for sidewalks.
[00:05:20] Similarly, system development charges; so just different fee mechanisms that are levied on to developers at development typically.
[00:05:30] Next, and probably more promising, publicly-supported, passed by public vote of people who wanted to fund sidewalks. There’s different avenues to take, and that is widely popular in a range of cities too.
[00:05:43] There’s a paper that I’m happy to pass along, it was a meta-analysis. They were looking at sidewalk audits and it actually said how they staffed those audits. Sometimes it was students, sometimes it was temps, sometimes it was city staff, and it also said how long it took them to complete those.
[00:05:58] Because if you have more people on the ground, you complete it faster, of course. And there are different ways of getting the timing down, like, you do one every five years, we do different segments or, that all has to be worked out too, to keep it ongoing (Right).
[00:06:12] When we wrapped up in June we had a little bit of extra funding for students over the summer. The city staff said, ‘Really helpful, like, this is great, but we really want to this case study knowledge about what other places have done, and that would be more helpful than continuing to collect data points.’
[00:06:26] So we transitioned to that. But the great thing about this is this (app) is still active. We can continue submitting data through this, and it spits out into really nice, handy maps, instantaneously. So it’s relatively little work on the back end once it’s all in there, and it can continually update as you add more data. So this still exists and is ready for use as needed.
[00:06:47] If there’s an agency wants to carry on or, whoever, I could talk to you all: ‘Here’s how you use the tool, make sure it’s just consistent.’ But yeah, it’s absolutely, it could be an opportunity for like a UO class engagement if the city or ATC is interested in engaging in sidewalk issues further, we’re always happy to collaborate.
[00:07:06] John Q: Anne Brown at the Active Transportation Committee Nov. 9. The UO launches a sidewalk audit. Their app is available to continue mapping sidewalk conditions across Eugene. For more, contact Willow Hamilton at the city, or your neighborhood association.