Long Tom Watershed Council notes some water quality improvements
10 min read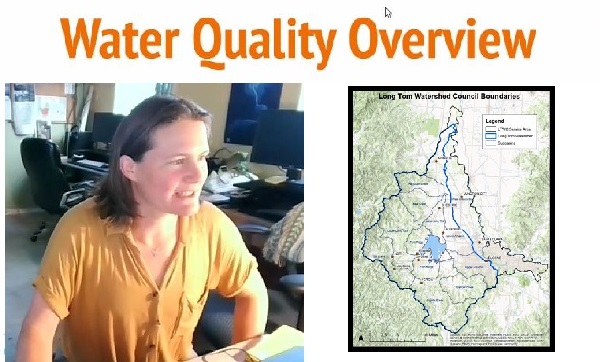
Presenter: The Long Tom Watershed Council shared an overview of water quality projects with the Oregon Community Rights Network June 18. Here’s Aquatic Program Manager Jed Kaul:
[00:00:11] Jed Kaul: I’m Jed Kaul. I’m a fish biologist i’ve worked at the Long Tom Watershed Council for 16 years now, mostly focused on aquatic habitat restoration projects, working with lots of landowners to develop a wide variety of projects.
[00:00:26] I’m just going to start with like an overview of the watershed and of the Long Tom Watershed Council. There are two separate geographies, kind of.
[00:00:34] The Long Tom watershed is 410 square miles. It’s a little bit unique compared to like the Siuslaw or the McKenzie in that it is 92% privately owned.
[00:00:45] Lots of agriculture in the valley floor, lots of small woodland owners and industrial timber in the kind of fringes in the Coast Range and in the southern part of the Coyote Creek and Spencer Creek watersheds.
[00:00:58] Lots of rural residential uses and a handful of small communities. And then of course, Eugene and Springfield, an urban area, so it’s pretty diverse, for sure.
[00:01:08] Our service area is slightly larger than the Long Tom watershed. We work with landowners along the mainstem Willamette from Eugene all the way north past the confluence of the Long Tom and the Willamette.
[00:01:19] And we also work collaboratively with the McKenzie and Middle Fork Willamette watershed councils in the Eugene Springfield urban area on urban watershed improvement projects.
[00:01:32] Watershed councils are a little bit unique. There’s lots of watershed councils in Oregon. I believe that almost every watershed has a council now. A lot of support through the state government, lottery revenues help fund us.
[00:01:45] Most watershed councils started in the mid-to-late 90s, as far as I know, when the state government set up kind of a formal structure for them and a funding mechanism through the Oregon Watershed Enhancement Board.
[00:01:56] So the Long Town Watershed Council, we started in 1997. First employee started in ’98, became an IRS nonprofit in 2007.
[00:02:06] Work is very diverse: water quality monitoring, habitat restoration projects. We have co-workers that work on prescribed fire and oak and prairie restoration. We have co-workers that work in the urban environment to improve water quality, and we also have a traditional ecological inquiry program that focuses on working with tribal youth and their families to help them explore projects focused on Indigenous land management practices.
[00:02:31] Rural habitats, that’s mostly where Amanda and I work. Amanda also works with the urban program as well.
[00:02:37] So lots of lots of action going on. I encourage you to check out our website.
[00:02:41] Presenter: Habitat and Water Quality Specialist Amanda Reinholtz:
[00:02:45] Amanda Reinholtz: My name is Amanda Reinholtz. I’m going to focus exclusively on water quality monitoring and the work that we’ve done over the past eight or so years has been primarily collecting water quality data on pesticide presence in water, stream temperature, and E. Coli bacteria. And I’m going to start with pesticides.
[00:03:10] We’ve been doing pesticide monitoring in Amazon Creek and only Amazon Creek since about 2011 as part of the Pesticide Stewardship Partnership program, a totally non-regulatory monitoring program that focuses on voluntary changes in response to identified pesticide problems based on the data we’re collecting.
[00:03:34] And in Amazon Creek we are taking grab samples for dipping bottles in the creek about once every couple weeks throughout the spring, summer, and fall and sending them to the DEQ lab for analysis. They analyze for a suite of about 135 different pesticides and we’ve been taking these samples at five locations in and around the city of Eugene in Amazon Creek to get kind of a variety of different land use signatures.
[00:04:06] So we’ve got pretty residential signature, the sampling sites near the 29th Street dog park. We’ve got a site out by Beltline Road on West 11th that captures more commercial activity. We have a site capturing some industrial activity on the A1 channel off Awbrey Lane, east of ’99.
[00:04:28] And we have our most downstream site captures more of an agricultural land use signature. There’s a lot of grass seed farming, some other mixed agriculture, southern part of Amazon Creek.
[00:04:39] So we would get this data where they’re analyzing for like 135 analytes. So we get back what analytes are seen, which pesticides or pesticide breakdown products are seen and at what concentrations. And to make sense of it, we have to compare it to something and there aren’t really water quality standards for pesticides. But the EPA does publish aquatic life benchmarks which are thresholds in the concentration of different pesticides where, according to the best science available, we know it’s probably going to harm something in the aquatic system. So for any given pesticide, there might be like five different aquatic life benchmarks that are relevant to fish or macroinvertebrates or plant life.
[00:05:25] And the program takes the most sensitive threshold and compares the concentrations of that pesticide at that kind of lowest level value at which we think it might do harm to something in the aquatic system.
[00:05:36] Just to get more of an apples-to-apples comparison, like: What does this concentration of pesticide mean in the waterway in a more realistic sense.
We’re also looking at how often we’re seeing any pesticide in the water. Is it very rare? Are we seeing it all the time? And just overall kind of the number of different pesticides we’re seeing in a given sample or in a given year. We’re looking out for the kind of cumulative and synergistic impacts that are a little harder to know but are still worrisome.
[00:06:06] So we’re seeing 24 different pesticides or pesticide breakdown products over the past three years of that suite of like 135 (analytes).
[00:06:17] And most of them are products that we’re seeing rarely and at concentrations that are well below the aquatic life benchmark.
[00:06:27] There’s another set of pesticides that we’re seeing them very frequently, sometimes almost 100 % of the time in our water samples, but at very low concentrations compared to the aquatic life benchmark.
[00:06:41] And that includes Roundup, glyphosate, the active ingredient in Roundup, and its breakdown product, AMPA, as well as a breakdown product of another really commonly used herbicide, diclobenil. The breakdown product is sometimes called BAM.
[00:06:55] So we’re seeing them often, but not at levels in a given sample that we know would do harm.
There’s another set of pesticides that we’re seeing occasionally at higher levels. Notably in here, I think for especially folks in the urban environment, is imidacloprid. It’s an insecticide that’s used in like 250 registered products.
[00:07:22] And we see it randomly all over the urban environment and very rarely in industrial and agricultural areas. And pretty much whenever we see it, it’s over the aquatic life benchmark because it’s very toxic at very low levels. It does a good job at harming insects. It tends to harm our aquatic macro invertebrates.
[00:07:42] And then when we consider our pesticide of highest concern, Diuran, we see fairly frequently and often at levels that are approaching the aquatic life benchmark or are slightly above the aquatic life benchmark, and we’re seeing that more in agricultural areas. We’re seeing that further down in the watershed.
[00:08:04] Very quickly, because I can’t spent too much time on any one thing, unfortunately, but I wanted to give you some sense of the fact that we are seeing these pesticides everywhere naturally as we’re going downstream, you would expect to see more and more pesticides as they’re kind of like attenuating with water flow downstream. So we are seeing that and that’s kind of hard to parse out from like new, yeah that signature is a little hard to separate from you know, like what’s coming in from further down in the watershed.
[00:08:40] But we see exceedances everywhere: in rural residential; in agricultural; and industrial. And we tend to see more of these exceedances in the industrial and furthest downstream, our agricultural site, but it’s not exclusive to those sites.
[00:09:02] I want to remind myself to mention that overall, over the past, like, 15 years, we have seen some positive trends in our data results. We are still seeing pesticides dropping off of our, like, three-year list and generally seeing with some exceptions like positive trends in our pesticide results. They’re not like huge major improvements but like a good, good forward, slight forward progress over the years.
[00:09:34] What are we doing as a watershed council to address pesticides? We promote integrated pest management, which can include not using pesticides or can include minimizing use of pesticides, using them responsively and responsibly.
[00:09:49] We host integrated pest management workshops for pesticide applicators. It’s something we’ve been doing recently, and we also promote a lot of best management practices that can help attenuate or capture pesticides that are moving into the environment in urban areas like stormwater management facilities, or in our rural areas, riparian buffers, filter strips, grass, waterways, different things that can help capture sediment and pesticides before they’re moving into our streams.
[00:10:18] We’ve also been measuring stream temperature pretty consistently actually over the past like 15 or so years. We capture hourly stream temperatures throughout the summer. We’ve got native fish and other aquatic organisms that are quite sensitive to high temperatures.
And high temperatures can also contribute to other water quality problems, notably algal blooms and like cyanotoxins and blue-green algae blooms that can further degrade water quality and cause issues for drinking water providers like the city of Monroe, that pulls its drinking water from the long time downstream.
[00:10:57] Things that can contribute to high stream temperatures: direct solar input, the shortwave radiation directly from the sun is probably the most obvious, but there’s also kind of that long wave ambient heat that’s harder to do anything about.
[00:11:15] And water quantity I think is the less obvious contributor to high stream temperatures. Water is difficult to heat. The more water you have in the stream, the cooler it tends to stay. There’s less water, it’s easier to heat, and so it tends to get hotter.
[00:11:33] We’re getting daily maximum temperature values and getting a seven-day average moving window value, we’re comparing it against state standards, in this case a standard of 18 degrees C, kind of like a temperature that’s comfy for our native fish.
[00:11:51] Below 18 degrees they’re pretty happy. In most of our watershed, we’re exceeding 18 degrees either from like a month to most of the summer.
[00:12:05] There’s cooler temperatures up in our headwaters, a few places higher in the watershed, and we’re still monitoring these lower reaches of the watershed because we know they’re hotter. But further down, temperatures are getting uncomfortable for native fish throughout the summer.
[00:12:22] What are we doing to keep streams cool? A lot of planting trees and shrubs along streams to prevent that direct solar, like, shortwave radiation. Dam removal and modification, some of the structures can have big impacts, positive impacts on water temperatures.
[00:12:41] And finally, our final set of recent water quality monitoring data is E. coli, and there are other things that come along with that, other nasty microorganisms, as well as nutrient pollution that comes along.
[00:12:55] So when you see E. coli counts, you can think just, like, fecal contamination in general, is what we’re thinking about.
[00:13:03] Where does it come from? The guts of animals, and those animals can be our livestock, our pigs, our sheep, horses, or also a big one—it can come from our guts, frequently our septic systems, sometimes municipal wastewater systems, and also wildlife.
[00:13:19] A single sample with a level that exceeds about 400 organisms per microliter is considered above the standard. And how often are we seeing results that are above the standard? In some cases, quite a bit, like here in Lower Amazon Creek and also a site in Bear Creek, and the Owens Creek tributary to Bear Creek, over 40% of the time we were seeing exceedances of that water quality sample.
[00:13:52] What are we doing to help keep fecal matter out of streams? We work with great folks at OSU Extension, if you’re interested, that have wonderful resources on septic systems and septic system maintenance.
[00:14:07] We do some fencing work, but again, agricultural best management practices. We work with our friends at the Upper Willamette Working Lands Program and the Upper Willamette Soil and Water Conservation District, particularly who can help with some of those projects.
[00:14:22] So just to kind of summarize some of that recent water quality monitoring, we have seen impairments in each of those three areas: in pesticides, water temperature, and E. coli. We have strong evidence that these impairments are coming from all sectors, urban residential, rural residential, agricultural, industrial, everywhere is part of the problem.
[00:14:50] And some statistically valid evidence that things are improving over time and some kind of like qualitative evidence with some of the other criteria that we might be seeing some improvements through time, but there’s some mixed signal in there too.
[00:15:07] And finally, I know folks have brought up cyanobacteria, the blue-green algae. They’re like a bacteria that is naturally present in waterways but thrives in warm, nutrient rich water. And they can produce cyanotoxins that are harmful or even potentially deadly to animals like dogs or people.
The Oregon Health Authority issues advisories when they know about cyanotoxin blooms. And there is a new advisory for Fern Ridge Reservoir right now. But that’s the best actual in-person monitoring source.
[00:15:47] But there’s also an EPA tool called CyAN for Cyanobacteria Assessment Network. And you have to create, like, a login, but it is a remote sensing tool that estimates the amount of cyanobacteria in larger water bodies. So it includes like Dorena Lake, Triangle Lake, Fern Ridge Reservoir, and can give some indication, although it can be skewed, about whether and how much cyanobacteria are in our water body at a given I wanted to, wanted to bring up those tools just because there’s been recent questions and recent interest.
[00:16:29] Presenter: That’s part of a presentation from the Long Tom Watershed Council to the Oregon Community Rights Network June 18. Staff members Jed Kaul and Amanda Reinholtz shared an overview of the watershed council and said although water quality is impaired in places by pesticides, high temperatures, and E. coli, there are small signs of improvement.