Pete Parsons predicts colder weather from La Niña in February
8 min read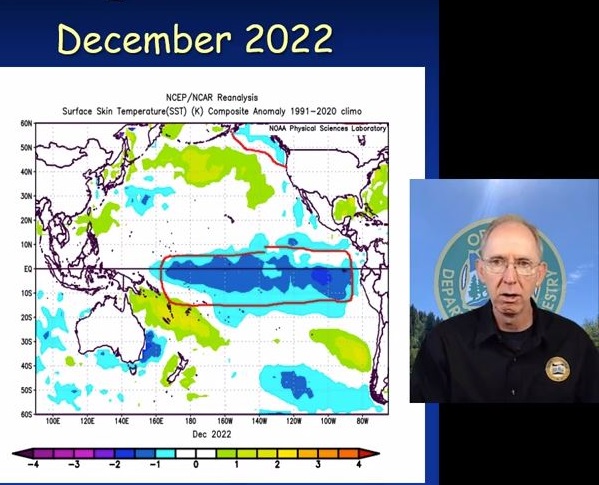
Here’s a look at our next three months with the La Niña weather pattern, from Pete Parsons.
[00:00:04] Pete Parsons: Hey, I’m meteorologist Pete Parsons with the Oregon Department of Forestry. Hope 2023 is treating you great, and will continue to do so. We’re going to look forward at the February through April forecast period.
[00:00:16] I start off with looking at the tropical Pacific Ocean temperatures, and the departures in normal of the sea surface temperatures over the Pacific Basin. Why is that important? Because we know that the Tropical Pacific Ocean temperatures impact global weather patterns in certain ways. El Niños give certain weather patterns, La Niñas certain ones, ENSO-neutral—that has different weather patterns associated with it.
[00:00:43] And the Tropical Pacific Ocean temperatures change more slowly than the weather patterns. The Tropical Pacific Ocean temperatures get the changes first, then you get changes in the weather patterns. Ah! That’s what gives us some predictability.
[00:00:58] So if I look at past years that had similar tropical ocean temperatures to this year, or what I call my ‘analog years,’ then I look at the weather from those years, it’ll help give us a glimpse at the tendencies that we could have going forward for this year—tendencies different from just the normal 30-year climate normals that we use. And that makes this process better than just using those 30-year normals. It’s not always perfect. In fact, sometimes it can mislead you, but more often than not, it’ll get you a little closer to the real solution, than just using the normals for a 30-year period.
[00:01:36] How about that?
[00:01:36] So one of the things I look at to find those analog years is an index called the Southern Oscillation Index, or SOI for short. It’s the difference in pressure between Tahiti and Darwin, Australia, and it gives us an idea of how strong the trade winds are in the Western Pacific and Central Pacific. And if they’re stronger than normal, it keeps the warm waters bottled up in the Western Pacific and leads us into a La Niña situation.
[00:02:04] That’s what we have right now.
[00:02:05] Another thing I look at is the Oceanic Niño Index, or ONI for short. And that’s a measure of the actual temperatures in the Central Pacific. So if the ONI is positive, that means that area is warmer than normal. If it’s negative, it means it’s colder than normal. If it’s warmer than normal for an extended period of time, at least three months of the index, that puts us up into El Niño. If it’s colder than normal for three months or more, that puts us down in the La Niña range. Well, we’re down in the La Niña range.
[00:02:33] This is the third winter in a row of La Niña, and our records don’t go back very far—only back to 1950 for good data—but we haven’t had four La Niña winters in a row during that period, and this was our third. So, statistically, the odds favor us getting out of La Niña, and we probably will, but not for sure.
[00:02:52] My top three analog years, {1999-2000, 2008-2009, 2011-2012}, line up fairly closely with the current year, not only where we are now, but where we’ve been. That’s important. It’s the evolution over time as well as where we are right now.
[00:03:08] Did these top three analog years have unique, similar weather events—similar to each other, but interesting weather events? And did they all have them or did a couple of them just have ’em? And, lo and behold, that frequently happens, when you get all of them lining up.
[00:03:24] And I use what happened going forward in the weather from those three analog years to predict our current years. So that’s how I do the game here.
[00:03:33] If you go back in time at all, 1957, 1972 were also good matches, but they’re farther back. Climate change does impact analog forecasting. No way around it. And the farther you go away from the current year, the greater you’re going to see an error due to climate change, which is a constant. How about that? Climate change is a constant. Always happens. Will never go away. Climate’s always going to change. Always going to cause error in an analog forecast. You want to try to get years as close to the current year as you can.
[00:04:05] Pacific Decadal Oscillation is a measure of the Northern Pacific, not the Tropical (Pacific) but the Northern (Pacific). There’s circulation patterns up there as well, probably more responsive to the ENSO signal. They tend to couple together, but it’s important if you can line up the analogs with that ocean pattern as well, that’s an even stronger match.
[00:04:24] That’s what I do. It’s that simple. I don’t make it more complicated. Yes, there’s other things I could use, there’s all kinds of oscillations at different levels of the atmosphere and all around the globe. This is a big driver. It’s a known driver. It’s a dominant driver.
[00:04:40] There’s other pieces. Yes, you could probably use those and make the forecast even better. I totally believe that. Maybe you’re a young scientist, you want to get out there and do this. What a great thing to do. You could go out there and and do a process like this and make it even better. There you go.
[00:04:56] La Niñas tend to give cooler than normal Aprils in general. So this would indicate probably not seeing a quick melt to the snowpack. Probably add to it in March and then hold on. So that’s good news in terms of the drought situation.
[00:05:08] So for the three-month period, even though we’re going to have big month-to-month swings, I don’t see any big overall departures for the three-month period, which is also classic for La Niña. Any given month—and we’ve had this—huge swings: warm/cold, warm/cold. But then you look at a three-month period, it’s like, ‘That’s just, it’s pretty average weather.’ No, it wasn’t! It just averaged out over the three-month period.
[00:05:29] And that’s what we’re likely going to see.
[00:05:32] The best chance for cold weather—real early in February. Again, that 1972 analog had that. We were just on the edge of the cold in December, right before Christmas, when we got that real cold east wind up in Northwest Oregon (and Portland) and in the Gorge. Man, it was cold for a couple of days! And that skewed the December temperatures cold just because it was such a huge anomaly for a couple of days. That could happen again in early February.
[00:05:57] This shows everything a little bit on the wet side, which is kind of a continuation of what we’ve had, and that would again, be good news for the snowpack situation.
[00:06:07] I’ve got a link to that—at the very bottom down here: Northwest Interagency Coordination Center. They put a video together that shows you how the weather relates to fire season. They try to predict fire season. That’s even harder than trying to predict what the weather’s going to do. You try to predict what the weather’s going to do going forward, that’s one thing. That’s hard enough.
[00:06:26] The dynamic models, as I’ve said before, do really well for about 10 days, and then they blow up. They don’t do very well at all beyond that. In fact, they can be misleading. They give you a very specific answer that’s wrong, and you all agree, ‘We’re going to get this,’ and no, no, no, we’re not. It causes almost more harm than good, I would say, beyond about 10 days. That’s why I go to this analog method. And that’s got huge limitations.
[00:06:52] Then if you take that and then try to use that to forecast what the fire season’s going to be with the other variables involved in that—Oh my goodness! They’ve got their work cut out for ’em there at the Northwest Interagency Coordination Center. That, my friends, is a more difficult job than mine.
[00:07:08] There’s also a PowerPoint on the Oregon Department of Agriculture website that explains my methods in detail. It goes into some of what I just mentioned—I’m predicting how the weather will go relative to the climate normal for the next three months. In other words, what’s the departure from the climate normal going to be, for three months out.
[00:07:29] Drop me an email, give me a phone call. I’ll get back to you and answer some of your questions.
[00:07:33] Enjoy the rest of your month of January.
[00:07:36] We’ll see about the cold weather in February. There is a possibility, real iffy, might be on the edge of another cold air mass, and we’ve also got the chance of some cold frost bringing some snow down to pretty low elevations all the way through March.
[00:07:50] So maybe even some valley snow is still yet to come. But so far I’ve been a little disappointed. Not a lot of valley snow this winter, but that happens sometimes. Even with La Niña, you don’t necessarily get a lot of snow right down in the valleys.
[00:08:03] In fact, if you’re a snow lover and you like snow right down on the valley floors, actually ENSO-neutral—that tropical Pacific region with near-normal ocean temperatures—that gives you the best chance, believe it or not, of seeing significant snow right down the valley floor. Another little secret for you: If you get ENSO-neutral conditions after an El Niño— going from El Niño to ENSO-neutral—that winter, you’ll almost always get significant valley snow. How about that? So to kind of put that one in your memory, when you see that pattern, take a look at that, and go, ‘Wait a minute. That, that Pete Parsons guy said we get that, we get snow—!’ There you go.
[00:08:45] That’s it for this month. Enjoy the rest of your January and we’ll catch up with you next month. Take care.
[00:08:51] John Q: Pete Parsons explains how he improves the forecast: Looking for ‘analog years’ with similar large-scale weather patterns. This month he invited young scientists to study his methods and improve them.